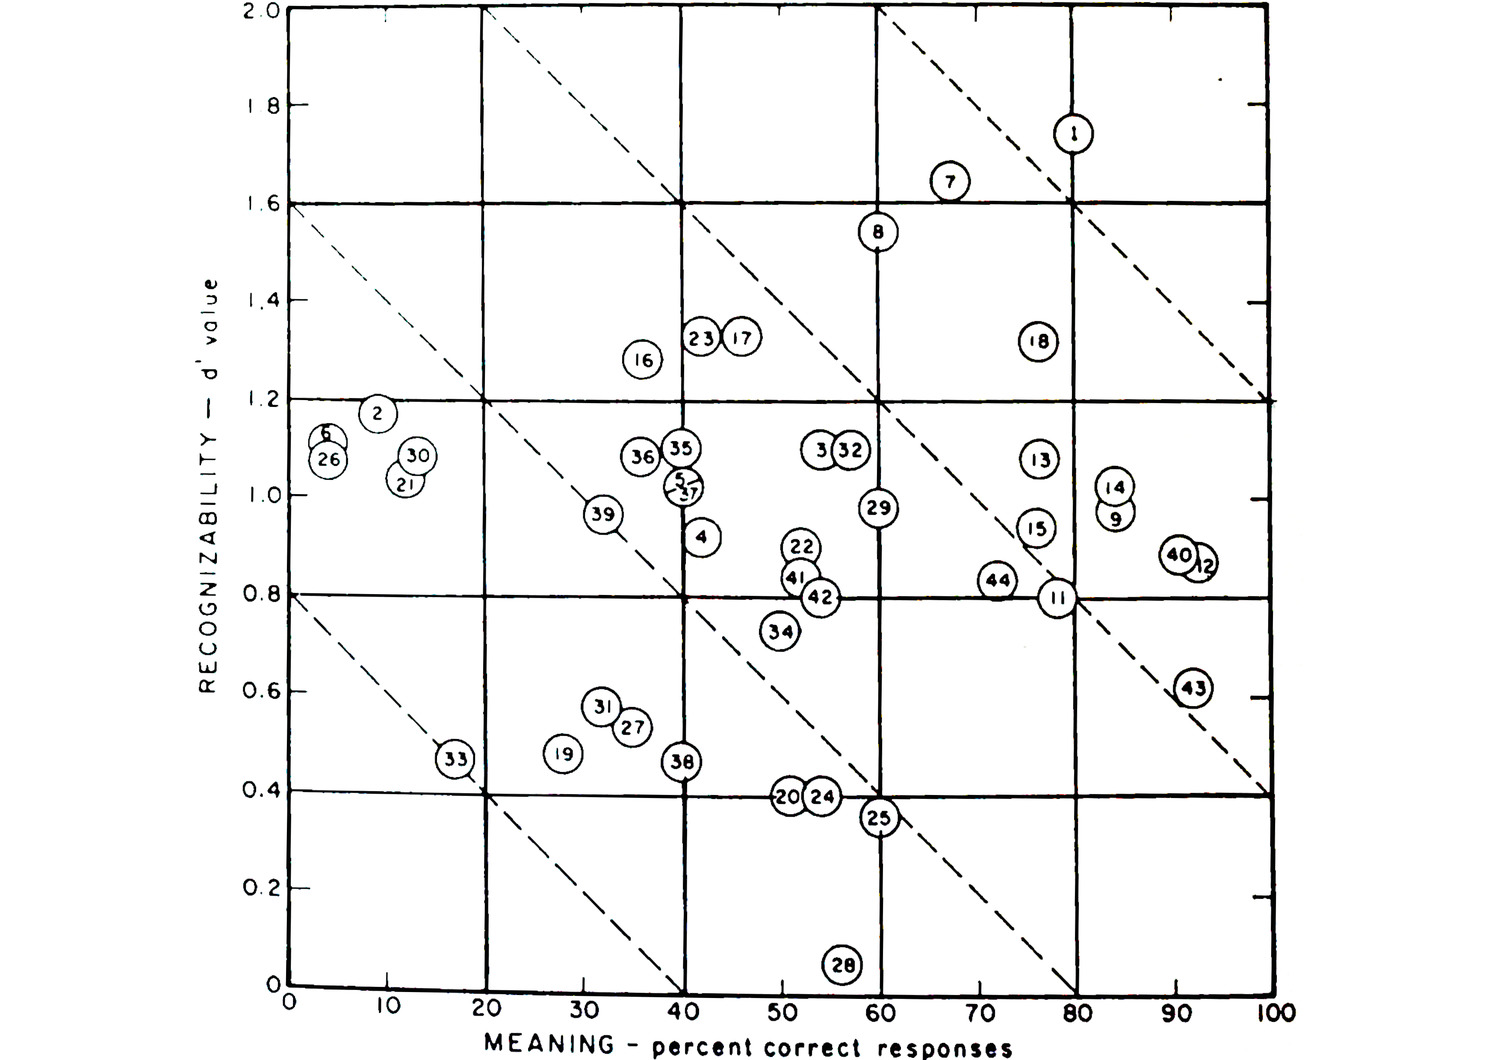
Research laboratory of John Lees and Melvin Forman, Combined evaluation diagram of the results of pictogram experiments, 1970
type
Visual representation
created
1970
posted
2023-07-05
classification number
description
The numbers correspond to the pictograms shown in Figure 4. Each pictogram, indicated by its number, is defined on the grid by two coordinates: one expresses its identifiability, the other its ease of interpretation. The closer a pictogram is to the top right-hand corner, the better it is; the worst are located closest to the bottom left-hand corner. A series of parallel lines with a negative slope can be drawn to separate pictograms according to their quality. The actual slope chosen determines the importance attached to identifiability. The steeper the slope, the greater the role given to identifiability.
credits
- © Droits réservés
from outer collection
user rights
Droits réservés. Usage documentaire à des fins de recherches académiques dans le cadre de la plateforme Problemata.